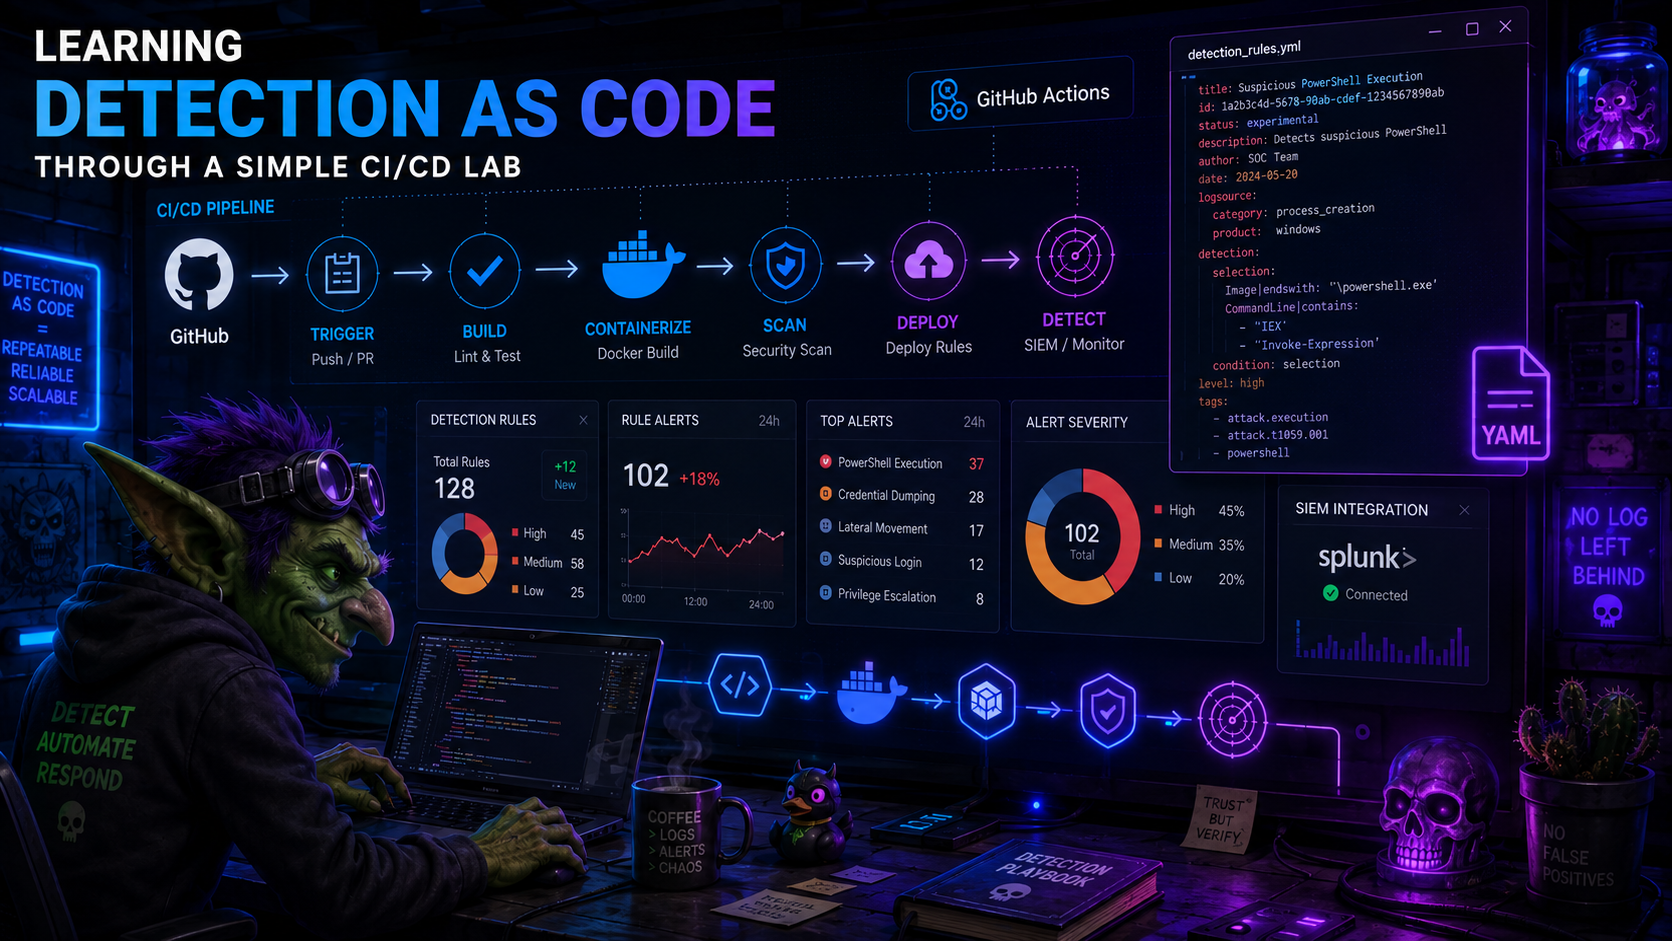
Learning Detection as Code Through a Simple CI/CD Lab
A practical lab note about building a small Detection as Code workflow with YAML detections, GitHub Actions, a self-hosted runner, and Splunk.
Some topics only really click for me when I build a small version of them and watch where they break.
Detection as Code was one of those topics. I had read about the idea before, and the pitch made sense: keep detections in version control, review changes, validate them automatically, and deploy them in a repeatable way. But reading about a workflow and actually wiring one together are very different things.
Before going into the lab, I will avoid trying to write a deep definition of Detection as Code here. These references already do a much better job, and each one points to broader material around the topic:
- Series: Detection Engineering: Practicing Detection-as-Code
- Splunk - What Is Detection as Code?
- Panther - How to Create a Code-Based Detection
- Panther Docs - Detections
- Elastic - detection-rules repository
- Elastic - The Engineer’s Guide to Elastic Detections as Code
- Sigma - About Sigma
My goal here is smaller: document the lab I built, what I wanted to validate, where the images fit in the workflow, and what I learned from turning the concept into a working CI/CD pipeline.
The project is here:
What I Wanted To Build
I wanted a tiny but complete loop:
- write a detection as a YAML file;
- validate the YAML structure locally and in CI;
- ask Splunk itself whether the SPL query parses;
- require pull requests before detections move forward;
- deploy the detection to Splunk as a saved search;
- keep enough metadata around the rule to make review and maintenance less painful.
I also wanted this to be Splunk-native on purpose. Sigma is great, and it is probably the right conversation for portability, but for this lab I wanted to understand the plumbing first: YAML file in Git, GitHub Actions pipeline, Splunk REST API, saved search created at the end.
The Lab Setup
The local setup has two main containers:
- Splunk, used as the target SIEM;
- a GitHub Actions self-hosted runner, used because the workflow needs to reach my local Splunk instance.
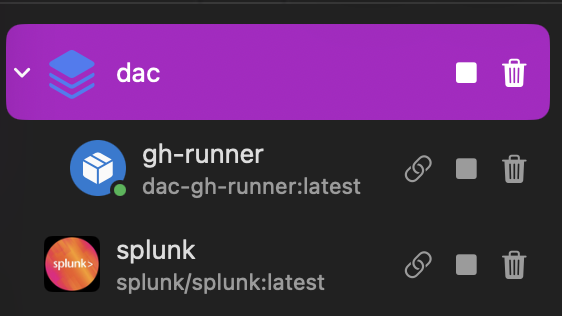
That runner detail matters. A GitHub-hosted runner would not be able to call https://splunk:8089 inside my local Docker/OrbStack network. So the runner lives next to Splunk and receives jobs from GitHub, but executes them locally.
The basic flow looks like this:
1
2
3
4
5
6
7
8
9
10
11
12
13
14
15
16
17
18
19
20
21
22
23
24
25
26
27
28
Analyst branch
     |
     v
Pull Request to dev
     |
     v
Validate changed detections
  - YAML syntax
  - JSON Schema
  - SPL parser check through Splunk REST API
     |
     v
Review and merge to dev
     |
     v
Pull Request from dev to main
     |
     v
Validate again
     |
     v
Merge to main
     |
     v
Dry-run deployment
     |
     v
Create or update Splunk saved searches
There are only two long-lived branches:
dev, which behaves like staging;main, which behaves like production.
Analysts work in short-lived branches like:
1
2
dev/alice/brute-force-login
dev/bob/powershell-encoded-command
For a lab, this is enough structure to make the workflow feel real without turning the project into branch-policy cosplay.
Repository Shape
The repository keeps the detection files, validation scripts, deployment scripts, workflow files, and runner setup together:
1
2
3
4
5
6
7
8
9
10
11
12
13
14
15
16
17
18
19
20
DaC/
|-- detections/
|   |-- endpoint/
|   |-- identity/
|   `-- network/
|-- schemas/
|   `-- detection.schema.json
|-- scripts/
|   |-- validate.py
|   |-- deploy.py
|   `-- splunk_client.py
|-- .github/
|   `-- workflows/
|       |-- validate-pr.yml
|       |-- deploy.yml
|       `-- cleanup-branches.yml
|-- runner/
|   |-- Dockerfile
|   `-- entrypoint.sh
`-- docker-compose.yml
In a real environment, I would probably split infrastructure from detection content. For the lab, keeping everything in one repository makes it easier to follow the whole path from rule file to Splunk saved search.
Writing A Detection
The detections live under detections/<category>/.
This is the brute-force login example:
1
2
3
4
5
6
7
8
9
10
11
12
13
14
15
16
17
18
19
20
21
22
23
24
25
26
27
28
29
30
31
32
33
34
name: "Detect Brute Force Login Attempts"
id: "d5e6f7a8-b9c0-4d1e-af2b-3c4d5e6f7a8b"
version: 1
status: testing
author: "security-team"
date: "2026-05-06"
modified: "2026-05-06"
description: "Detects brute force login attempts by identifying accounts with a high number of failed authentication events within a short window"
type: alert
search: |
  index=windows EventCode=4625
  | bucket _time span=5m
  | stats count as failed_attempts values(Source_Network_Address) as src_ips
      by _time, Account_Name
  | where failed_attempts >= 10
  | eval risk=case(failed_attempts >= 50, "critical", failed_attempts >= 20, "high", true(), "medium")
  | sort -failed_attempts
schedule:
  cron: "*/10 * * * *"
  earliest: "-10m"
  latest: "now"
alert:
  condition: "search count > 0"
  severity: high
  suppress: true
  suppress_period: "1h"
tags:
  mitre_attack:
    - T1110.001
    - T1110.003
  platform:
    - Windows
  category: identity
splunk_app: "search"
This is not meant to be a perfect production rule. It is a useful test object because it has the pieces I wanted the pipeline to care about: a query, schedule, alert metadata, lifecycle status, ATT&CK tags, and a target Splunk app.
The status field became especially useful:
| Detection status | Splunk saved search state |
|---|---|
production | enabled |
draft | disabled |
testing | disabled |
deprecated | disabled |
That lets me deploy something into Splunk without pretending it is already ready to alert in production.
There is an important design caveat here, though. In this first version, status lives inside the detection file and the deployment script uses it directly to decide whether the saved search should be enabled. That is simple and visible, but it also means promotion becomes a content change. If the SPL, schedule, tags, and metadata are already reviewed, changing only status: testing to status: production would still require the same detection to pass through the flow again just to flip that field.
A more mature version could separate the detection definition from the effective deployment state. The YAML could still keep a lifecycle hint, but GitHub Actions could pass the environment status during deployment: testing for dev, draft for review or pre-production stages, and production only after the approved production path. That way, the same reviewed detection can move through environments without requiring a second rule change whose only purpose is changing a tag-like field.
Schema Validation
The first validation layer is boring in the best possible way: does the file match the contract?
The schema lives in schemas/detection.schema.json. It checks required fields, accepted statuses, accepted alert types, UUID format, categories, severity values, and MITRE tag format.
A small piece of it looks like this:
1
2
3
4
5
6
7
8
9
10
11
12
13
14
15
16
17
{
  "required": ["name", "id", "version", "status", "author", "description", "type", "search", "tags"],
  "properties": {
    "status": {
      "type": "string",
      "enum": ["draft", "testing", "production", "deprecated"]
    },
    "type": {
      "type": "string",
      "enum": ["alert", "report", "scheduled_report"]
    },
    "tags": {
      "type": "object",
      "required": ["category"]
    }
  }
}
The validator also prints warnings for things that should be visible during review but do not necessarily need to block the PR:
1
2
3
4
5
6
7
8
9
def warnings_for(detection: dict) -> List[str]:
    warns = []
    if detection.get("status") == "draft":
        warns.append("Detection is still in 'draft' status - not yet ready for review")
    if not detection.get("tags", {}).get("mitre_attack"):
        warns.append("No MITRE ATT&CK tags defined")
    if not detection.get("schedule") and detection.get("type") in ("alert", "scheduled_report"):
        warns.append("No schedule defined for an alert-type detection")
    return warns
When I intentionally broke a rule, the pipeline did what I wanted: it failed before the detection could move forward.
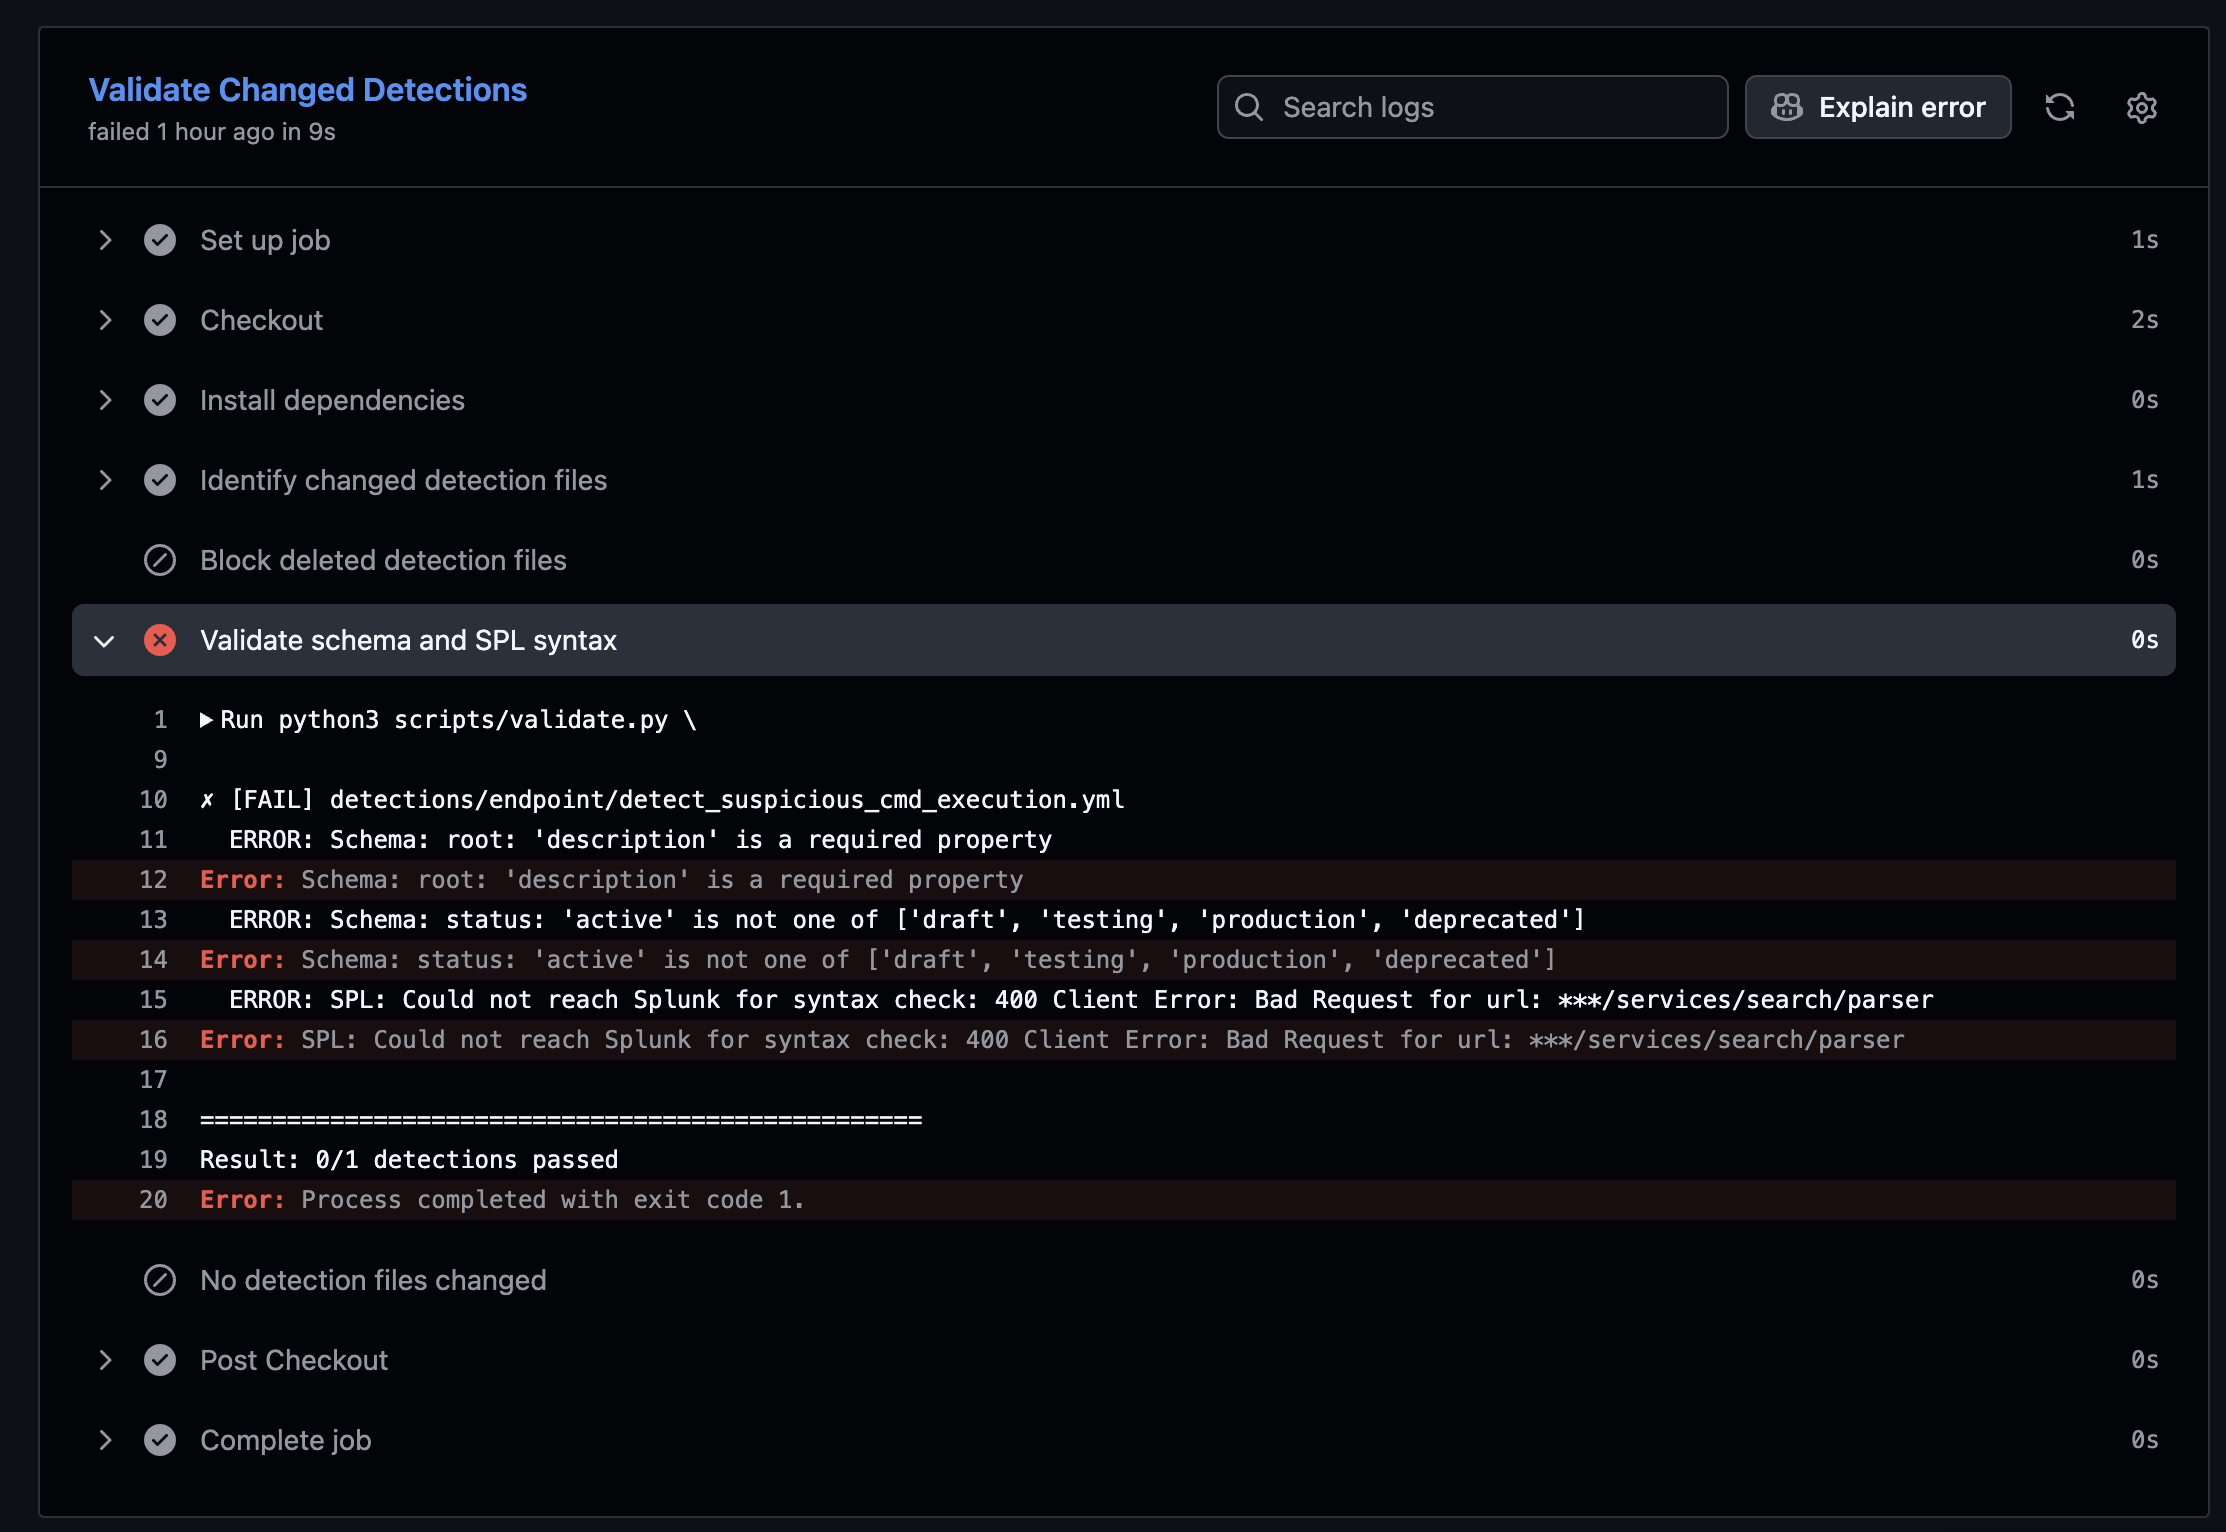
This screenshot is a good reminder of why I like this kind of automation. A missing description or an invalid status should not become a reviewer debate. The pipeline can catch it quickly and loudly.
Asking Splunk About The SPL
The next layer is more interesting. A YAML file can be valid and still contain a broken SPL query.
So the validator can call Splunk’s parser endpoint:
1
2
3
4
5
6
7
8
9
10
def check_spl_syntax(search: str, client) -> Tuple[bool, str]:
    try:
        result = client.validate_spl(search)
        messages = result.get("messages", [])
        errors = [m for m in messages if m.get("type") == "FATAL"]
        if errors:
            return False, errors[0].get("text", "SPL syntax error")
        return True, ""
    except Exception as e:
        return False, f"Could not reach Splunk for syntax check: {e}"
This was the part where the lab started to feel useful. Instead of only saying “the YAML looks fine”, the pipeline asks the actual platform whether the search can be parsed.
It will not tell me whether the detection is good. It will not solve tuning. It will not decide whether the threshold makes sense. But it does catch a class of silly mistakes before they waste human review time.
Pull Request Validation
The PR workflow runs when a pull request targets dev or main and touches detection content or validation logic:
1
2
3
4
5
6
7
8
9
10
11
12
13
14
15
on:
  pull_request:
    branches: [dev, main]
    paths:
      - "detections/**/*.yml"
      - "schemas/**"
      - "scripts/validate.py"
      - "scripts/splunk_client.py"
      - "requirements.txt"
      - ".github/workflows/validate-pr.yml"

jobs:
  validate:
    name: Validate Changed Detections
    runs-on: [self-hosted, linux, dac]
One detail I liked: if the schema or validation scripts change, the workflow validates every detection, not only the changed ones. If I break the contract, I want to know what existing content I broke.
When the rule passes, GitHub Actions gives a clean result:
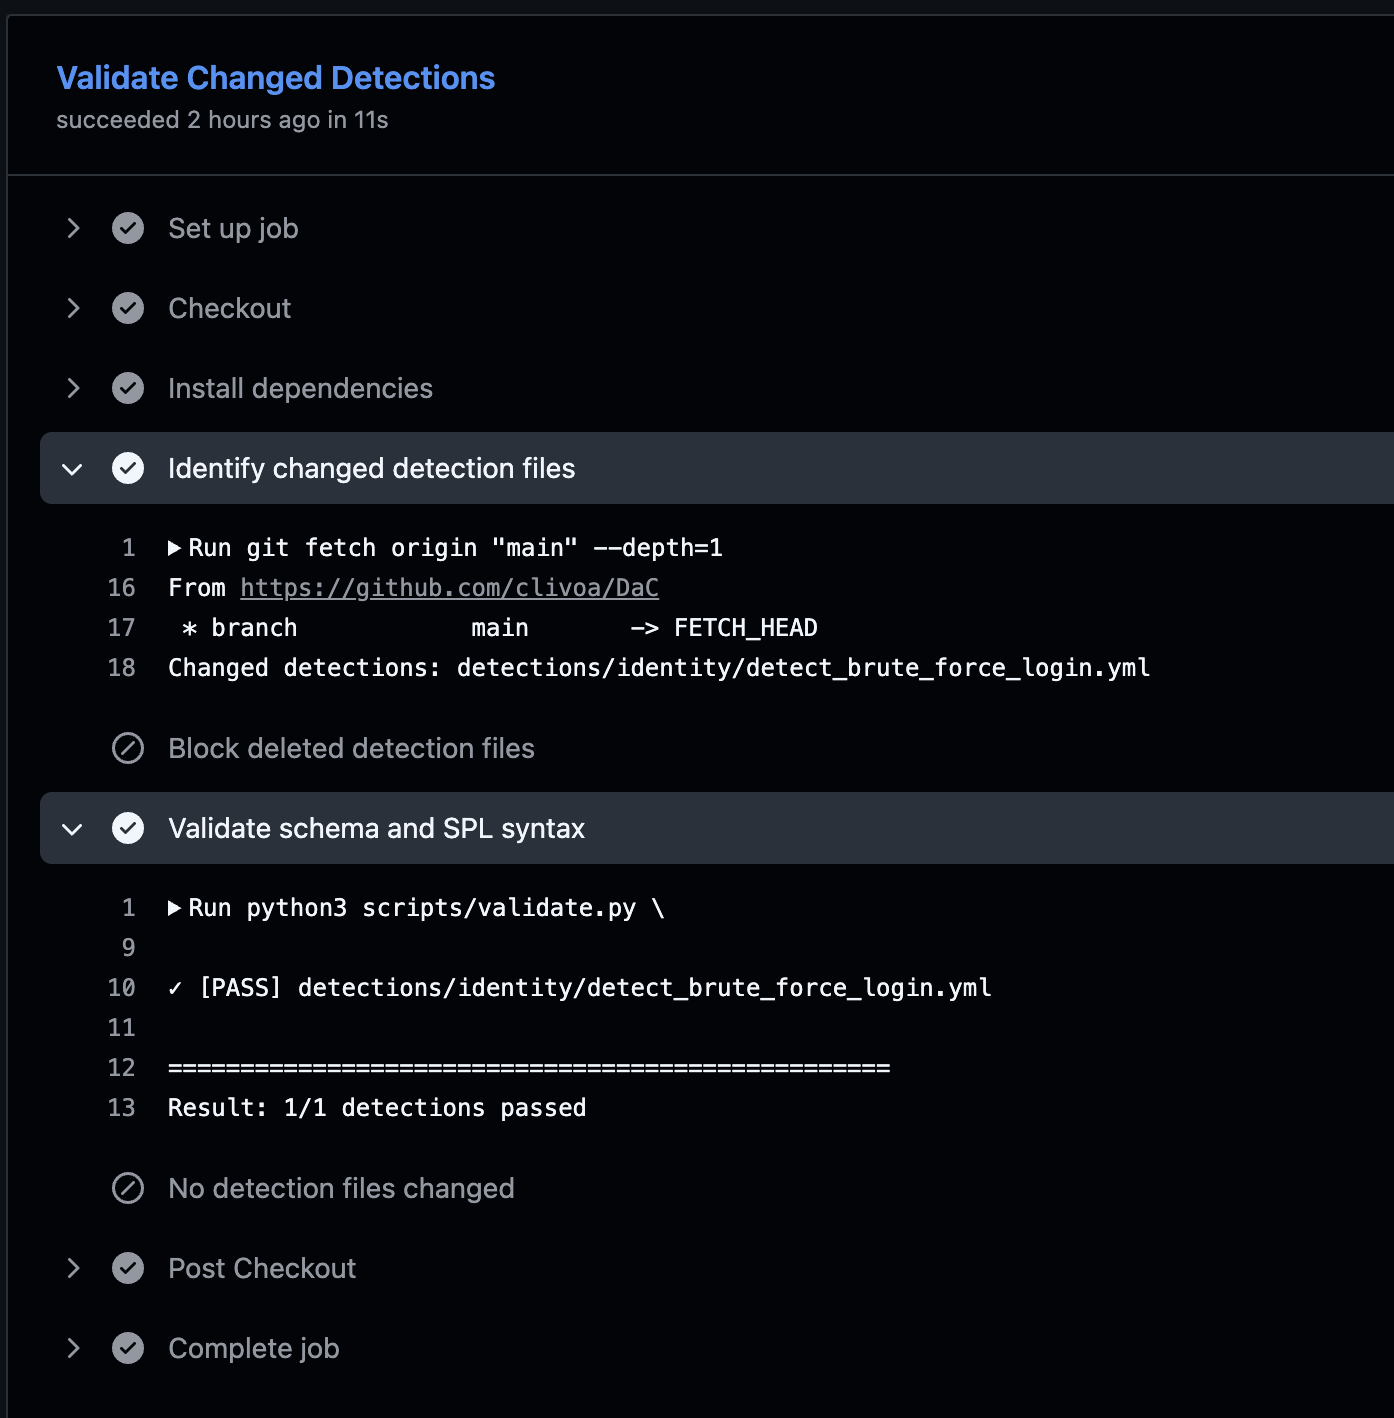
At that point the reviewer can spend time on the actual detection questions:
- Does the SPL match the described behavior?
- Is the threshold reasonable for the data source?
- Are the ATT&CK mappings useful?
- Should this really be
testing, or is it ready forproduction?
That is the review I want humans doing.
The Self-Hosted Runner
The runner is registered in GitHub with the self-hosted, linux, and dac labels.
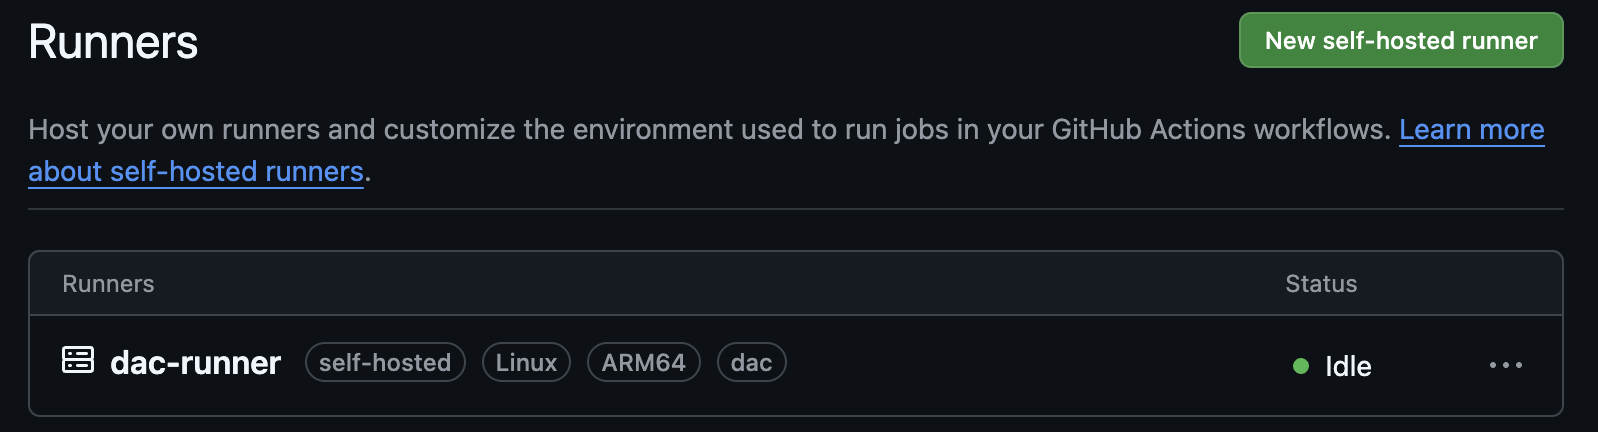
The workflow targets those labels:
1
runs-on: [self-hosted, linux, dac]
The environment variables are simple:
1
2
3
SPLUNK_URL=https://splunk:8089
SPLUNK_TOKEN=<token>
SPLUNK_APP=search
For this lab, that is enough. In a real setup, this is where I would slow down and think about runner isolation, secret scope, workflow permissions, and production approvals. But I did not want the first version of the lab to disappear into governance before the basic pipeline worked.
Deployment To Splunk
Deployment happens when changes reach main.
The deploy workflow does three things:
- checks whether the push to
maincame from a merged pull request; - runs a dry-run deploy;
- creates or updates the Splunk saved search.
The Python deploy script maps YAML fields into Splunk saved search parameters:
1
2
3
4
5
6
7
8
9
10
11
12
13
14
15
16
17
18
19
20
21
22
SEVERITY_MAP = {
    "informational": 1,
    "low": 2,
    "medium": 3,
    "high": 4,
    "critical": 5,
}

def to_splunk_params(detection: dict) -> Dict[str, Any]:
    params: Dict[str, Any] = {
        "description": detection.get("description", ""),
        "disabled": "0" if detection.get("status") == "production" else "1",
        "is_scheduled": "0",
    }

    if schedule := detection.get("schedule"):
        params["is_scheduled"] = "1"
        params["cron_schedule"] = schedule.get("cron", "*/15 * * * *")
        params["dispatch.earliest_time"] = schedule.get("earliest", "-15m")
        params["dispatch.latest_time"] = schedule.get("latest", "now")

    return params
In hindsight, this is the exact place where the lab could evolve. Instead of reading only detection["status"], the deploy step could receive an explicit deployment status from GitHub Actions:
1
2
deploy_status = os.getenv("DEPLOY_STATUS", detection.get("status", "testing"))
disabled = "0" if deploy_status == "production" else "1"
With that model, dev could deploy the saved search as disabled, while the production workflow could enable the same reviewed detection after the proper approval path. The repository history would then distinguish between changes to detection logic and changes to deployment state.
And this is the end result in Splunk:
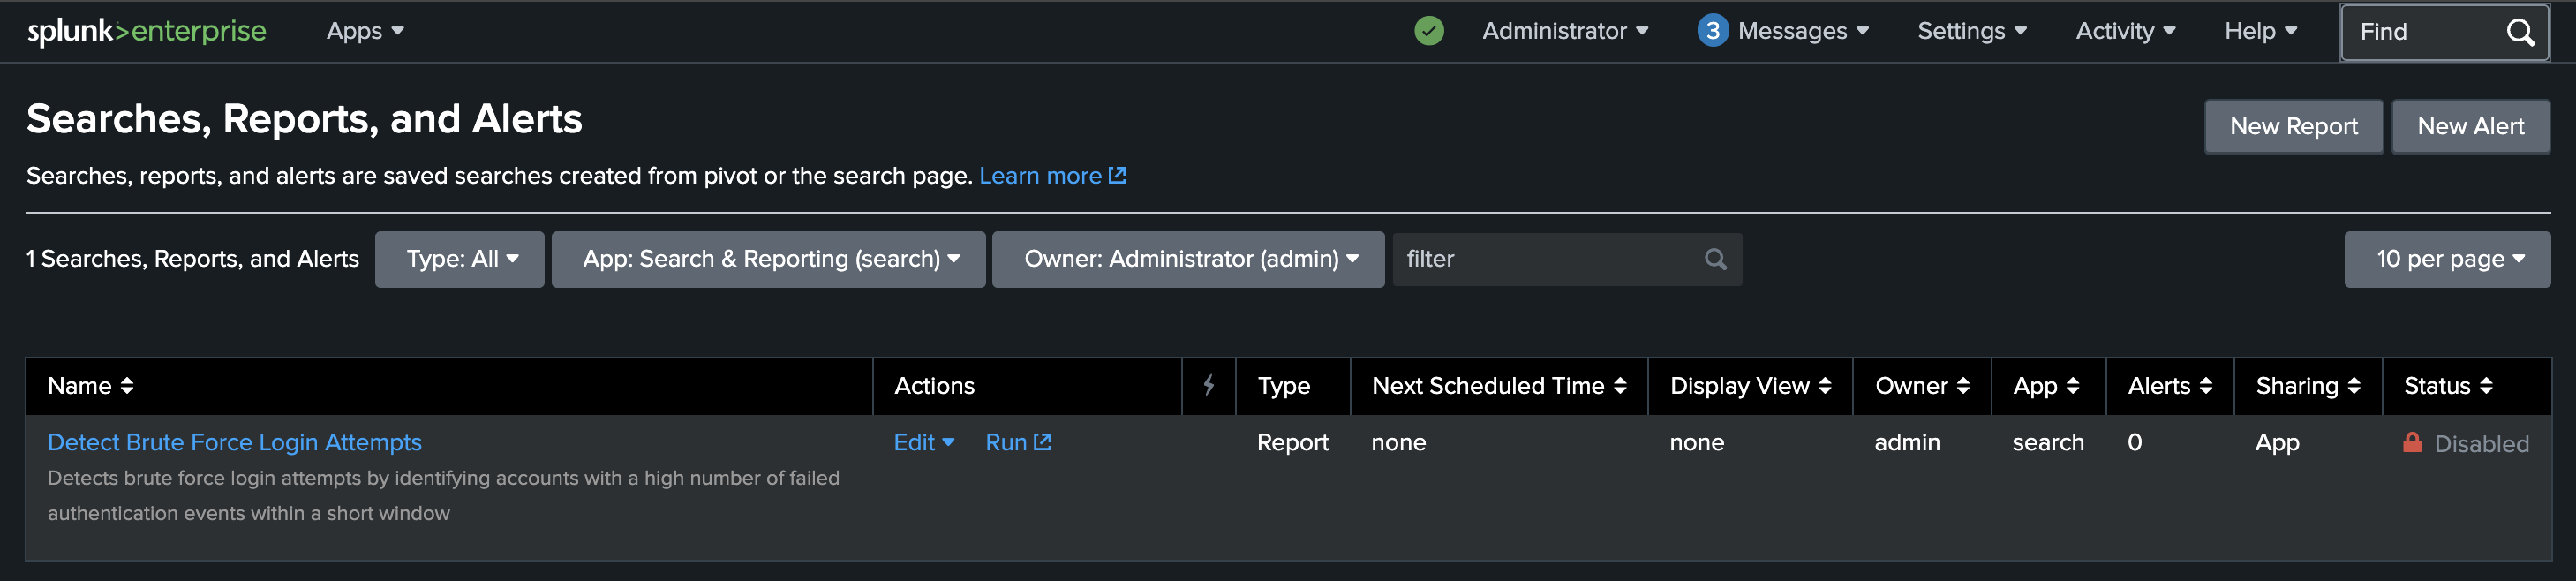
The brute-force detection is present as a saved search, but it is disabled because its YAML status is testing. That is exactly what I wanted: deployed for validation and visibility, not silently promoted into an active production alert.
A Small Governance Choice
I also made the pipeline block deleted detection files.
To retire a detection, the file should be updated instead:
1
status: deprecated
This is a small rule, but I like it. Deleting a detection file is too quiet. Marking it as deprecated leaves a clearer trail and gives the deployment process a chance to disable the saved search instead of pretending the detection never existed.
What I Learned
This lab made the idea feel much more concrete.
The useful parts were not complicated:
- Git made detection changes easier to see.
- JSON Schema caught boring mistakes early.
- Splunk parser validation caught broken SPL before merge.
- Pull requests gave the detection a review path.
- Deployment became repeatable instead of a manual UI step.
testingandproductionstatus gave me a simple lifecycle control.
The missing parts are also clear. A more mature version could add sample datasets, expected-result tests, better ATT&CK coverage reporting, Sigma compatibility, documentation generation, environment approvals before production deployment, and a cleaner separation between detection lifecycle metadata and environment-driven deployment status.
But for a first lab, this was enough. I did not need to build the perfect Detection as Code platform. I needed to build a small version that made the workflow visible.
Final Takeaway
This post is not meant to be the definitive explanation of Detection as Code. The links at the beginning are better starting points for that.
What I wanted was a working lab that connects the dots: YAML detection, schema validation, SPL validation, pull request review, self-hosted runner, and Splunk deployment.
Once that loop exists, the rest becomes easier to discuss. You can improve the schema, add tests, tune the branch model, introduce Sigma, or make deployment safer. But the basic habit is already there: detections are not just saved searches in a UI anymore. They are files with history, review, validation, and a path to production.